class: left, bottom, title-slide, dictionary, title-slide # Studying News Use with Computational Methods ## Text Analysis in R, Part I: Text Description, Word Metrics and Dictionary Methods ### Julian Unkel ### University of Konstanz ### 2021/06/21 --- # Agenda .pull-left[At it's most basic, automated content analysis is just counting stuff: most frequent words, co-occuring words, specific words, etc. We can already learn a lot about a corpus of documents just by looking at word metrics and applying dictionaries. Even if they are not part of the main research interest, it still might prove useful to use the following methods to describe and familiarize yourself with a large text corpus. ] -- .pull-right[Our agenda today: - Text description and word metrics - Frequencies - Keywords in context - Collocations - Cooccurences - Lexical complexity - Keyness - Dictionary-based methods - Basics - Applying categorical dictionaries - Applying weighted dictionaries - Validating dictionaries ] --- class: middle # Text description and word metrics --- # Setup We will be mainly using the packages known from the last few sessions: ```r library(tidyverse) library(tidytext) library(quanteda) ``` ``` ## Package version: 3.0.0 ## Unicode version: 13.0 ## ICU version: 69.1 ``` ``` ## Parallel computing: 16 of 16 threads used. ``` ``` ## See https://quanteda.io for tutorials and examples. ``` ```r library(quanteda.textstats) ``` --- # Setup We will be working with a sample of 10,000 Guardian articles published in 2020: ```r guardian_tibble <- readRDS("data/guardian_sample_2020.rds") ``` --- # Setup Before we start, let's add a column indicating the day the respective article was published in an extra column (you'll soon enough see why): ```r guardian_tibble <- guardian_tibble %>% mutate(day = lubridate::date(date)) ``` ```r guardian_tibble %>% select(date, day) ``` ``` ## # A tibble: 10,000 x 2 ## date day ## <dttm> <date> ## 1 2020-01-01 00:09:23 2020-01-01 ## 2 2020-01-01 00:34:18 2020-01-01 ## 3 2020-01-01 02:59:09 2020-01-01 ## 4 2020-01-01 06:20:56 2020-01-01 ## 5 2020-01-01 07:00:58 2020-01-01 ## 6 2020-01-01 08:00:01 2020-01-01 ## 7 2020-01-01 08:50:00 2020-01-01 ## 8 2020-01-01 09:01:00 2020-01-01 ## 9 2020-01-01 10:00:02 2020-01-01 ## 10 2020-01-01 10:57:37 2020-01-01 ## # ... with 9,990 more rows ``` --- # Preprocessing Just like last time, we'll do some preprocessing of our data by creating a corpus object, tokenizing all documents and creating a DFM. Keep all of these objects, as different methods require differently structured data. ```r guardian_corpus <- corpus(guardian_tibble, docid_field = "id", text_field = "body") guardian_tokens <- guardian_corpus %>% tokens(remove_punct = TRUE, remove_symbols = TRUE, remove_numbers = TRUE, remove_url = TRUE, remove_separators = TRUE) %>% tokens_tolower() guardian_dfm <- guardian_tokens %>% dfm() ``` --- # Word frequencies `featfreq()` counts all features. Not that the resulting list is not sorted: ```r featfreq(guardian_dfm) ``` ``` ## there is a message woven ## 18152 77962 187892 930 21 ## into everything the prime minister ## 11856 1856 453840 2482 3635 ## says about these fires carefully ## 9596 20189 6695 394 281 ## threaded through every pronouncement that ## 9 6086 4226 5 86117 ## they are not extraordinary unprecedented ## 28376 39966 32524 476 526 ## with skill of man who ## 54959 141 205550 2789 24401 ## made pre-politics career messaging scott ## 6620 1 1314 155 517 ## morrison's narrative disaster in no ## 86 381 490 157939 12547 ## way different from disasters australians ## 6723 2873 37464 102 590 ## have faced past terrible event ## 43054 677 2739 368 1135 ## to be sure but one ## 225486 43044 1548 38462 18749 ## which we will recover resilience ## 18940 29679 24175 271 210 ## and aussie spirit always shown ## 197056 36 431 3242 640 ## during our long history similar ## 5489 11591 4069 2162 1306 ## crises whatever trials befallen us ## 156 657 382 5 11965 ## never succumbed panic do this ## 4020 37 324 10384 33182 ## now face current fire crisis ## 11200 2593 1611 1200 3670 ## generations went before including first ## 259 2416 8077 5282 10442 ## also natural floods global conflicts ## 13465 693 107 2358 81 ## disease drought he told new ## 1315 134 41298 5610 13902 ## [ reached getOption("max.print") -- omitted 135380 entries ] ``` --- # Word frequencies `topfeatures()` returns the *n* most common features (default: 10): ```r topfeatures(guardian_dfm) ``` ``` ## the to of and a in that is for on ## 453840 225486 205550 197056 187892 157939 86117 77962 75739 66469 ``` --- # Word frequencies Some more options, including grouping for docvars, are available with `textstat_frequency()`: ```r textstat_frequency(guardian_dfm, n = 5, groups = pillar) ``` ``` ## feature frequency rank docfreq group ## 1 the 73441 1 1713 Arts ## 2 of 38415 2 1708 Arts ## 3 a 37528 3 1711 Arts ## 4 and 37483 4 1711 Arts ## 5 to 33283 5 1708 Arts ## 6 the 31317 1 860 Lifestyle ## 7 a 18502 2 842 Lifestyle ## 8 and 18090 3 850 Lifestyle ## 9 to 17431 4 854 Lifestyle ## 10 of 15079 5 846 Lifestyle ## 11 the 253420 1 5325 News ## 12 to 127021 2 5321 News ## 13 of 110784 3 5319 News ## 14 and 100977 4 5317 News ## 15 a 91590 5 5301 News ## 16 the 42100 1 845 Opinion ## 17 to 21923 2 845 Opinion ## 18 of 21479 3 845 Opinion ## 19 and 18732 4 845 Opinion ## 20 a 17047 5 845 Opinion ## [ reached 'max' / getOption("max.print") -- omitted 5 rows ] ``` --- # Word frequencies Let's get some more useful results by removing stopwords: ```r dfm_remove(guardian_dfm, stopwords("english")) %>% textstat_frequency(n = 5, groups = pillar) ``` ``` ## feature frequency rank docfreq group ## 1 one 3929 1 1330 Arts ## 2 like 3124 2 1096 Arts ## 3 people 2883 3 909 Arts ## 4 just 2389 4 993 Arts ## 5 says 2376 5 504 Arts ## 6 one 1807 1 647 Lifestyle ## 7 can 1787 2 592 Lifestyle ## 8 says 1551 3 263 Lifestyle ## 9 like 1499 4 566 Lifestyle ## 10 people 1298 5 433 Lifestyle ## 11 said 28843 1 4490 News ## 12 people 13557 2 3579 News ## 13 one 8569 3 3514 News ## 14 government 8521 4 2841 News ## 15 new 8351 5 3095 News ## 16 people 2404 1 650 Opinion ## 17 one 1850 2 699 Opinion ## 18 can 1573 3 633 Opinion ## 19 us 1509 4 544 Opinion ## 20 now 1398 5 615 Opinion ## [ reached 'max' / getOption("max.print") -- omitted 5 rows ] ``` --- # Word frequencies More relevant features emerge after some strong trimming of the DFM: ```r dfm_trim(guardian_dfm, max_docfreq = .20, docfreq_type = "prop") %>% textstat_frequency(n = 3, groups = pillar) ``` ``` ## feature frequency rank docfreq group ## 1 film 1686 1 558 Arts ## 2 show 1480 2 612 Arts ## 3 music 1358 3 440 Arts ## 4 fashion 508 1 99 Lifestyle ## 5 food 498 2 194 Lifestyle ## 6 add 430 3 139 Lifestyle ## 7 trump 4029 1 826 News ## 8 police 3621 2 926 News ## 9 cases 3443 3 1249 News ## 10 trump 808 1 184 Opinion ## 11 political 660 2 291 Opinion ## 12 black 632 3 150 Opinion ## 13 league 2266 1 684 Sport ## 14 players 1962 2 669 Sport ## 15 season 1824 3 688 Sport ``` --- # Keywords in context Use `kwic()` to get a view of up to 1000 occurences of a keyword in a given context window (default: 5 words before/after): ```r kwic(guardian_tokens, "belarus") %>% as_tibble() ``` ``` ## # A tibble: 66 x 7 ## docname from to pre keyword post pattern ## <chr> <int> <int> <chr> <chr> <chr> <fct> ## 1 959 609 609 and europe we went ~ belarus she said it was rea~ belarus ## 2 1633 445 445 jack on a stick as belarus gives the uk a desu~ belarus ## 3 2033 321 321 that were stuck in ~ belarus and they were after~ belarus ## 4 2637 112 112 wants noah explaine~ belarus president alexander~ belarus ## 5 2945 62 62 the authoritarian p~ belarus and turkmenistan ov~ belarus ## 6 2978 196 196 countries president~ belarus has made the claim ~ belarus ## 7 3656 54 54 sporting plans alth~ belarus burundi tajikistan ~ belarus ## 8 3692 14 14 include thousands t~ belarus for ve day parade d~ belarus ## 9 3694 133 133 looked very differe~ belarus where elderly veter~ belarus ## 10 3901 350 350 action beyond the b~ belarus haaland's desire to~ belarus ## # ... with 56 more rows ``` --- # Keywords in context Use `phrase()` for multi-word keywords and set window size with `window`: ```r kwic(guardian_tokens, phrase("champions league"), window = 3) %>% as_tibble() ``` ``` ## # A tibble: 321 x 7 ## docname from to pre keyword post pattern ## <chr> <int> <int> <chr> <chr> <chr> <fct> ## 1 20 126 127 restart of the champions l~ all competition~ champions ~ ## 2 29 171 172 to swap probab~ champions l~ qualification a~ champions ~ ## 3 42 1331 1332 performance in~ champions l~ fixture suggest~ champions ~ ## 4 96 419 420 the league and champions l~ and his selecti~ champions ~ ## 5 113 45 46 scored in genk~ champions l~ defeat by liver~ champions ~ ## 6 138 148 149 qualify for the champions l~ victory against~ champions ~ ## 7 138 396 397 rather than the champions l~ however there w~ champions ~ ## 8 155 202 203 scored in barc~ champions l~ final defeat to champions ~ ## 9 155 312 313 victory in the champions l~ final in june champions ~ ## 10 223 480 481 bus carrying l~ champions l~ winners drive p~ champions ~ ## # ... with 311 more rows ``` --- # Collocations *Collocations* define words directly appearing after each other and can be computed with `textstat_collocations()`. The output is sorted by the `\(\lambda\)` parameter, which increases if *exactly* this combination of words is more common than the same words appearing in other collocations. Note that this can be very computationally expensive, so adjust the `min_count()` parameter accordingly: ```r guardian_tokens %>% tokens_remove(stopwords("english")) %>% textstat_collocations(min_count = 100) %>% as_tibble() ``` ``` ## # A tibble: 615 x 6 ## collocation count count_nested length lambda z ## <chr> <int> <int> <dbl> <dbl> <dbl> ## 1 prime minister 1880 0 2 8.92 169. ## 2 last week 1567 0 2 5.33 168. ## 3 last year 1694 0 2 4.95 167. ## 4 social media 1074 0 2 6.67 157. ## 5 public health 1196 0 2 5.17 149. ## 6 chief executive 986 0 2 8.39 149. ## 7 white house 871 0 2 6.45 145. ## 8 years ago 1081 0 2 6.22 142. ## 9 human rights 756 0 2 7.45 141. ## 10 climate change 733 0 2 6.54 135. ## # ... with 605 more rows ``` --- # Collocations We can look for multi-word collocations of any size by adjusting the `size` parameter: ```r guardian_tokens %>% tokens_remove(stopwords("english")) %>% textstat_collocations(min_count = 10, size = 4) %>% as_tibble() ``` ``` ## # A tibble: 653 x 6 ## collocation count count_nested length lambda z ## <chr> <int> <int> <dbl> <dbl> <dbl> ## 1 andrés manuel lópez obrador 18 0 4 12.9 2.96 ## 2 new york los angeles 10 0 4 10.9 2.93 ## 3 prime minister narendra modi 19 0 4 11.0 2.82 ## 4 crown prince mohammed bin 16 0 4 9.91 2.81 ## 5 kenan malik observer columnist 12 0 4 10.0 2.55 ## 6 prime minister boris johnson 52 0 4 6.42 2.39 ## 7 department education spokesperson said 13 0 4 4.41 2.26 ## 8 prime minister viktor orbán 20 0 4 8.51 2.20 ## 9 thousands inboxes every weekday 20 0 4 7.51 2.06 ## 10 ruby princess cruise ship 13 0 4 5.81 2.04 ## # ... with 643 more rows ``` --- # Cooccurences *Cooccurences* look for words appearing in the same document (and not just directly after each other). Cooccurences are best represented as a *feature cooccurence matrix* of size `n_features * n_features`. Create one with `fcm()`. Again, to decrease computational load, some trimming of the DFM may be useful: ```r guardian_fcm <- guardian_dfm %>% dfm_remove(stopwords("english")) %>% dfm_trim(min_termfreq = 100, max_docfreq = .25, docfreq_type = "prop") %>% fcm() ``` --- # Cooccurences ```r guardian_fcm ``` ``` ## Feature co-occurrence matrix of: 6,009 by 6,009 features. ## features ## features message everything prime minister says fires carefully ## message 293 237 436 567 1206 81 34 ## everything 0 590 468 616 4777 128 77 ## prime 0 0 2576 7549 2154 119 104 ## minister 0 0 0 4361 2928 197 156 ## says 0 0 0 0 42752 430 493 ## fires 0 0 0 0 0 1414 7 ## carefully 0 0 0 0 0 0 21 ## extraordinary 0 0 0 0 0 0 0 ## unprecedented 0 0 0 0 0 0 0 ## skill 0 0 0 0 0 0 0 ## features ## features extraordinary unprecedented skill ## message 76 69 17 ## everything 156 98 51 ## prime 151 226 21 ## minister 193 271 21 ## says 696 652 243 ## fires 41 139 6 ## carefully 21 18 7 ## extraordinary 48 55 6 ## unprecedented 0 68 7 ## skill 0 0 13 ## [ reached max_feat ... 5,999 more features, reached max_nfeat ... 5,999 more features ] ``` --- # Cooccurences A simple way to get at the most common cooccurences is by transforming the FCM into a Tibble with the `tidy()` function: ```r guardian_fcm %>% tidy() %>% filter(document != term) %>% arrange(desc(count)) ``` ``` ## # A tibble: 16,598,119 x 3 ## document term count ## <chr> <chr> <dbl> ## 1 died hospital 25139 ## 2 died family 16223 ## 3 president trump 15829 ## 4 trump biden 14949 ## 5 hospital family 14809 ## 6 trump trump's 13384 ## 7 hospital covid-19 12021 ## 8 died worked 12013 ## 9 trump election 11424 ## 10 died covid-19 11209 ## # ... with 16,598,109 more rows ``` --- # Lexical complexity *Lexical complexity* may be indicated through a document's readability and lexical diversity. `textstat_readability()` offers several readability measures, by default the `Flesch Reading Ease` which is based on the average sentence length and average syllable count per word (note that we need to use the corpus object in this case, as sentences are preserved here). Lower values indicate a lower readability: ```r textstat_readability(guardian_corpus) %>% as_tibble() ``` ``` ## # A tibble: 10,000 x 2 ## document Flesch ## <chr> <dbl> ## 1 1 39.6 ## 2 2 60.7 ## 3 3 48.7 ## 4 4 52.5 ## 5 5 42.0 ## 6 6 46.9 ## 7 7 45.8 ## 8 8 55.2 ## 9 9 59.9 ## 10 10 47.6 ## # ... with 9,990 more rows ``` --- # Lexical complexity Accordingly, `textstat_lexdiv()` offers several measures to quantify the lexical diversity of documents. By default, the *Type-Token-Ratio* (unique tokens divided by number of tokens per document) is computed. Note that the *TTR* is heavily influenced by document length: ```r textstat_lexdiv(guardian_dfm) %>% as_tibble() ``` ``` ## # A tibble: 10,000 x 2 ## document TTR ## <chr> <dbl> ## 1 1 0.453 ## 2 2 0.634 ## 3 3 0.438 ## 4 4 0.669 ## 5 5 0.429 ## 6 6 0.427 ## 7 7 0.657 ## 8 8 0.509 ## 9 9 0.508 ## 10 10 0.491 ## # ... with 9,990 more rows ``` --- # Keyness Finally, *keyness* (and accordingly `textstat_keyness()`) presents a measure of the distinctivness of words for a certain (group of) documents as compared to other documents. For example, we can group our corpus by the `pillar` (Arts, Lifestyle, News, Opinion, or Sport) and get to the most distinctive terms for Sport documents by: ```r guardian_dfm %>% dfm_group(pillar) %>% textstat_keyness(target = "Sport") %>% as_tibble() ``` ``` ## # A tibble: 135,480 x 5 ## feature chi2 p n_target n_reference ## <chr> <dbl> <dbl> <dbl> <dbl> ## 1 league 14537. 0 2266 298 ## 2 players 12498. 0 1962 270 ## 3 game 8593. 0 1813 754 ## 4 season 8592. 0 1824 770 ## 5 football 6760. 0 1299 420 ## 6 team 6221. 0 1770 1309 ## 7 cup 6182. 0 1019 184 ## 8 club 6046. 0 1292 554 ## 9 player 4816. 0 828 181 ## 10 ball 4537. 0 803 197 ## # ... with 135,470 more rows ``` --- # Text description and word metrics **Exercise 1: Text description** `btw_tweets.csv` (on ILIAS) contains 1377 tweets by the three German chancellor candidates Annalena Baerbock, Armin Laschet & Olaf Scholz made in 2021, as obtained by Twitter's Academic API. - Load the tweets into R and do the necessary preprocessing - Investigate the tweets using the text and word metrics you just learned - What are the most common words? - What are the most common collocations? - What are the most distinct words per account? <center><img src="https://media.giphy.com/media/LmNwrBhejkK9EFP504/giphy.gif"></center> --- class: middle # Dictionary-based methods --- # Basics *Dictionaries* contain a list of predefined words (or other features) that should represent a latent construct. This is probably the simplest way to automatically anaylze texts for the presence of latent constructs. -- At their core, dictionary-based methods are just counting the presence of the dictionary words in the documents. Usually, this is based on two (implicit) assumptions: - **Bag-of-words**: Just like with many other automated text analysis methods, word order and thus semantical and syntactical relationships are ignored. - **Additivity**: The more words from the dictionary are found in a document, the more pronounced the latent construct. --- # Terminology Dictionaries are commonly differentiated along two dimensions, the first being the source of the dictionary: - **Organic** dictionaries are created for the specific research task from scratch, for example by theoretical assumptions about the latent construct(s), investigating the most common features, etc. - **Off-the-shelf** dictionaries are pre-made, (hopefully) pre-validadated dictionaries used for specific purposes, for example sentiment analysis. -- Second, dictionaries may be either categorical or weighted: - In **categorical** dictionaries, every word is valued the same. - In **weighted** dictionaries, weights are assigned to words. For example, in a positivity dictionary, "love" may have a higher weight than "like". --- # Applying categorical dictionaries We start by applying categorical dictionaries to texts. In `quanteda`, dictionaries are simply created by passing a named list of constructs represented in the dictionary, with each construct represent by a character vector of words. -- For demonstration purposes, we create our own dictionary from the populism dictionary by [Rooduijn & Pauwels (2011)](https://www.tandfonline.com/doi/full/10.1080/01402382.2011.616665). Note that dictionary terms may include asterisks for placeholders: ```r pop_words <- list(populism = c( "elit*", "consensus*", "undemocratic*", "referend*", "corrupt*", "propagand*", "politici*", "*deceit*", "*deceiv*", "shame*", "scandal*", "truth*", "dishonest*", "establishm*", "ruling*") ) ``` --- # Applying categorical dictionaries We create the actual dictionary by using `quanteda`'s `dictionary()` function. ```r pop_dictionary <- dictionary(pop_words) pop_dictionary ``` ``` ## Dictionary object with 1 key entry. ## - [populism]: ## - elit*, consensus*, undemocratic*, referend*, corrupt*, propagand*, politici*, *deceit*, *deceiv*, shame*, scandal*, truth*, dishonest*, establishm*, ruling* ``` --- # Applying categorical dictionaries Applying the dictionary to our corpus is simple as well: We use the function `dfm_lookup()` on our DFM (remember, word order doesn't matter). This counts out all features in the dictionary and reduces the dimensionality of the DFM to `n_documents * n_dictionary_constructs`: ```r guardian_pop <- dfm(guardian_dfm) %>% dfm_lookup(pop_dictionary) guardian_pop ``` ``` ## Document-feature matrix of: 10,000 documents, 1 feature (74.61% sparse) and 5 docvars. ## features ## docs populism ## 1 0 ## 2 0 ## 3 0 ## 4 0 ## 5 0 ## 6 0 ## [ reached max_ndoc ... 9,994 more documents ] ``` --- # Applying categorical dictionaries `tidytext`'s `tidy()` function is again helpful in transforming and analyizing the results. For example, we can sort by count to get the document ids of the documents with the highest count of dictionary words: ```r guardian_pop %>% tidy() %>% arrange(desc(count)) ``` ``` ## # A tibble: 2,539 x 3 ## document term count ## <chr> <chr> <dbl> ## 1 526 populism 16 ## 2 4257 populism 16 ## 3 5610 populism 14 ## 4 4799 populism 13 ## 5 8717 populism 13 ## 6 2727 populism 12 ## 7 9436 populism 12 ## 8 5169 populism 11 ## 9 5761 populism 11 ## 10 6214 populism 11 ## # ... with 2,529 more rows ``` --- # Applying categorical dictionaries Let's take a look at the article with highest count of populism terms (i.e., the *most populist* article in our corpus): ```r guardian_tibble %>% filter(id == 526) ``` ``` ## # A tibble: 1 x 7 ## id title body url date pillar day ## <int> <chr> <chr> <chr> <dttm> <chr> <date> ## 1 526 ‘Middle Cl~ Democrats ~ https://w~ 2020-01-20 11:00:24 Opini~ 2020-01-20 ``` It's the article [‘Middle Class’ Joe Biden has a corruption problem – it makes him a weak candidate | Zephyr Teachout](https://www.theguardian.com/commentisfree/2020/jan/20/joe-biden-corruption-donald-trump), an opinion piece about Joe Biden and the US election. --- # Applying categorical dictionaries Relying on counts does ignore document lenght, though, so longer documents have a per se higher chance of including dictionary terms. It is thus a good idea to weight the DFM beforehand to get the share of dictionary terms among the full document: ```r guardian_pop_prop <- guardian_dfm %>% dfm_weight(scheme = "prop") %>% dfm_lookup(pop_dictionary) guardian_pop_prop ``` ``` ## Document-feature matrix of: 10,000 documents, 1 feature (74.61% sparse) and 5 docvars. ## features ## docs populism ## 1 0 ## 2 0 ## 3 0 ## 4 0 ## 5 0 ## 6 0 ## [ reached max_ndoc ... 9,994 more documents ] ``` --- # Applying categorical dictionaries Let's check again the documents with the highest share of populist terms: ```r guardian_pop_prop %>% tidy() %>% arrange(desc(count)) ``` ``` ## # A tibble: 2,539 x 3 ## document term count ## <chr> <chr> <dbl> ## 1 4799 populism 0.0216 ## 2 526 populism 0.0171 ## 3 5141 populism 0.0163 ## 4 5761 populism 0.0146 ## 5 4257 populism 0.0143 ## 6 6259 populism 0.0139 ## 7 188 populism 0.0136 ## 8 5169 populism 0.0130 ## 9 4817 populism 0.0126 ## 10 6597 populism 0.0124 ## # ... with 2,529 more rows ``` --- # Applying categorical dictionaries One handy tool in applying dictionaries is `dfm_group()`. For example, we can group the DFM by `day` before applying the dictionary to get the share of populism in Guardian articles on each day: ```r guardian_pop_by_day <- guardian_dfm %>% dfm_group(day) %>% dfm_weight(scheme = "prop") %>% dfm_lookup(pop_dictionary) guardian_pop_by_day ``` ``` ## Document-feature matrix of: 366 documents, 1 feature (0.00% sparse) and 1 docvar. ## features ## docs populism ## 2020-01-01 0.0006833869 ## 2020-01-02 0.0004933129 ## 2020-01-03 0.0007507508 ## 2020-01-04 0.0004430268 ## 2020-01-05 0.0002653576 ## 2020-01-06 0.0012358648 ## [ reached max_ndoc ... 360 more documents ] ``` --- # Applying categorical dictionaries Let's plot this. When would we expect the highest share of populist terms? ```r p_pop_guardian_by_day <- guardian_pop_by_day %>% tidy() %>% mutate(day = as.Date(document)) %>% ggplot(aes(x = day, y = count)) + geom_line() + theme_classic() + scale_y_continuous(labels = scales::percent) + labs(x = NULL, y = "Share of populism terms") ``` --- # Applying categorical dictionaries ```r p_pop_guardian_by_day ``` <!-- --> --- # Applying categorical dictionaries **Exercise 2: Applying categorical dictionaries** The [Bing Liu opinion lexicon](https://www.cs.uic.edu/~liub/FBS/sentiment-analysis.html#lexicon) is a widely used, multi-categorical dictionary for sentiment analysis, including ~6000 terms indicating positive and negative sentiment. The word lists are stored in separate files (`positive-words.txt` and `negative-words.txt`) on ILIAS. Load them into R with `scan()`: ```r positive_words <- scan("data/positive-words.txt", what = character(), skip = 30) negative_words <- scan("data/negative-words.txt", what = character(), skip = 31) ``` --- # Applying categorical dictionaries **Exercise 2: Applying categorical dictionaries** Then: - create a `quanteda` dictionary with the two categories "positive" and "negative" - apply the dictionary to the Guardian corpus - investigate the difference between weighting the DFM proportionally before and after applying the dictionary - plot the sentiment by day <center><img src="https://media.giphy.com/media/LmNwrBhejkK9EFP504/giphy.gif"></center> --- # Applying weighted dictionaries Applying weighted dictionaries is simple as well, but relies on `tidytext` again. `tidytext()` also provides a function `get_sentiments()` to access common sentiment dictionaries. The AFINN dictionary is one widely used weighted dictionary: ```r get_sentiments("afinn") ``` ``` ## # A tibble: 2,477 x 2 ## word value ## <chr> <dbl> ## 1 abandon -2 ## 2 abandoned -2 ## 3 abandons -2 ## 4 abducted -2 ## 5 abduction -2 ## 6 abductions -2 ## 7 abhor -3 ## 8 abhorred -3 ## 9 abhorrent -3 ## 10 abhors -3 ## # ... with 2,467 more rows ``` --- # Applying weighted dictionaries In the `tidytext` style, applying dictionaries is just joining them with an unnested text corpus. Note that using `inner_join()` throws out all terms not found in the dictionary - if you want to preserve those terms, use `left_join()` instead: ```r guardian_afinn_sentiments <- guardian_tibble %>% unnest_tokens(word, body) %>% select(id, day, word) %>% inner_join(get_sentiments("afinn")) ``` ``` ## Joining, by = "word" ``` ```r guardian_afinn_sentiments ``` ``` ## # A tibble: 421,362 x 4 ## id day word value ## <int> <date> <chr> <dbl> ## 1 1 2020-01-01 carefully 2 ## 2 1 2020-01-01 disaster -2 ## 3 1 2020-01-01 no -1 ## 4 1 2020-01-01 disasters -2 ## 5 1 2020-01-01 terrible -3 ## 6 1 2020-01-01 spirit 1 ## 7 1 2020-01-01 disasters -2 ## 8 1 2020-01-01 panic -3 ## 9 1 2020-01-01 fire -2 ## 10 1 2020-01-01 crisis -3 ## # ... with 421,352 more rows ``` --- # Applying weighted dictionaries We can now use `tidyverse` function to group and summarise sentiment, for example per day: ```r p_guardian_sentiment_afinn <- guardian_afinn_sentiments %>% group_by(day) %>% summarise(sentiment = mean(value)) %>% ggplot(aes(x = day, y = sentiment)) + geom_line(color = "blue") + geom_hline(yintercept = 0, linetype = "dashed") + theme_classic() + labs(x = NULL, y = "Sentiment") ``` --- # Applying weighted dictionaries ```r p_guardian_sentiment_afinn ``` <!-- --> --- # Validating dictionaries Now to the one million dollar question: Do the values we just computed actually represent sentiment? -- **Validating** the results is arguably the most important task of not just dictionary-based methods, but also automated content analysis in general. Three common ways of validations include: - Comparing the results with (manual) gold standards - Computing data fit indices - Investigating meaningful relationships of results with other variables in the data (e.g., a terrorism dictionary should lead to higher scores in the aftermath of terrorist attacks) --- # Validating dictionaries with `oolong` The [`oolong`](https://github.com/chainsawriot/oolong) package provides a simple way for gold-standard validation directly in R. As it is still in early active development, the latest development version is usually the best choice: ```r remotes::install_github("chainsawriot/oolong") ``` -- As always, load it with `library()`: ```r library(oolong) ``` --- # Validating dictionaries with `oolong` We first create a random sample of our data for the gold standard test with the `gs()` function, indicating the construct to validate. Note that it is suggested to use at least 1% of the data for validation, but for demonstration purposes, let's stick to a smaller number of 20 articles: ```r gs_test <- gs(input_corpus = guardian_corpus, construct = "positive", exact_n = 20, userid = "Julian") gs_test ``` ``` ## ``` ``` ## -- oolong (gold standard generation) ------------------------------------------- ``` ``` ## :) Julian ``` ``` ## i GS: n = 20, 0 coded. ``` ``` ## i Construct: positive. ``` ``` ## ``` ``` ## -- Methods -- ``` ``` ## ``` ``` ## * <$do_gold_standard_test()>: generate gold standard ``` ``` ## * <$lock()>: finalize this object and see the results ``` --- # Validating dictionaries with `oolong` As outlined in the resulting object, we can now start coding the data (and thus providing a manual gold standard) by using the method `$do_gold_standard_test()`: ```r gs_test$do_gold_standard_test() ``` This opens a coding window in RStudio's *Viewer* pane: --- # Validating dictionaries with `oolong`  --- # Validating dictionaries with `oolong` After you have finished coding the data, `$lock()` it to perform the actual gold standard test: ```r gs_test$lock() ``` --- # Validating dictionaries with `oolong` We can now apply our dictionary as before by using the `$turn_gold()` method. This creates a `quanteda` corpus: ```r gs_corpus <- gs_test$turn_gold() gs_corpus ``` ``` ## Corpus consisting of 20 documents and 1 docvar. ## 2476 : ## "A meat-eating dinosaur with a feathered body, iron grip and ..." ## ## 2501 : ## "Three weeks ago, Tony Robinson completed a six-part series f..." ## ## 4695 : ## "My husband and I run a quirky, colourful music bar in Herefo..." ## ## 487 : ## "It’s time to go rogue with your eyeliner. Many SS20 catwalks..." ## ## 8787 : ## "The funniest sketch I’ve ever seen … Siblings – a hilarious ..." ## ## 2874 : ## "Americans consistently rate the Fox News Channel as one of t..." ## ## [ reached max_ndoc ... 14 more documents ] ``` ``` ## i Access the answer from the coding with quanteda::docvars(obj, 'answer') ``` --- # Validating dictionaries with `oolong` Let's apply the dictionary just as before: ```r gs_dict <- gs_corpus %>% tokens() %>% dfm() %>% dfm_weight(scheme = "prop") %>% dfm_lookup(liu_dict) gs_dict ``` ``` ## Document-feature matrix of: 20 documents, 2 features (2.50% sparse) and 1 docvar. ## features ## docs positive negative ## 2476 0.02156334 0.01617251 ## 2501 0.02357724 0.01788618 ## 4695 0.02657807 0.02214839 ## 487 0.04215852 0.02866779 ## 8787 0.01980198 0.03217822 ## 2874 0.03694268 0.05095541 ## [ reached max_ndoc ... 14 more documents ] ``` --- # Validating dictionaries with `oolong` We need one value per document to compare our manual codings to: ```r gs_values <- gs_dict %>% convert("data.frame") %>% mutate(sentiment = positive - negative) %>% pull(sentiment) gs_values ``` ``` ## [1] 0.0053908356 0.0056910569 0.0044296788 0.0134907251 -0.0123762376 ## [6] -0.0140127389 -0.0078843627 0.0189393939 0.0091324201 0.0132248220 ## [11] -0.0241545894 -0.0245231608 0.0035569106 -0.0186766275 -0.0126715945 ## [16] 0.0009569378 -0.0103412616 0.0017889088 -0.0063391442 -0.0343137255 ``` --- # Validating dictionaries with `oolong` Finally, use the `summarize_oolong()` function to get the test results: ```r gs_results <- summarize_oolong(gs_test, target_value = gs_values) gs_results ``` --- # Validating dictionaries with `oolong` The summary objects also includes a `plot()` method that displays various important measures at once: ```r plot(gs_results) ``` <!-- --> --- # Dictionaries and beyond Improve dictionary-based methods by: - Including negating bigrams - Removing common sources of error (phrases like "good bye", etc.) - Minding the context the dictionary was developed for - *Always* (re-)validating dictionaries -- Dictionaries provide a simple way for classifying documents into latent constructs. Supervised machine learning classification may drastically improve such classifications, but also come with increased effort. For example, look at [Rudkowsky et al., 2018](https://www.tandfonline.com/doi/full/10.1080/19312458.2018.1455817) for a word embeddings approach towards sentiment analysis. --- class: middle # Exercise solutions --- # Exercise solutions **Exercise 1: Text description** First, load the tweets (remember to explicitly read in Twitter IDs as character): ```r btw_tweets <- read_csv("data/tweets_btw.csv", col_types = list(id = col_character())) ``` Then, create a corpus: ```r btw_corpus <- corpus(btw_tweets, docid_field = "id", text_field = "text") ``` --- # Exercise solutions There are of course multiple possibilites to text preprocessing. This way, we remove most of (probably) unwanted features: ```r btw_tokens <- tokens(btw_corpus, remove_punct = TRUE, remove_symbols = TRUE, remove_numbers = TRUE, remove_url = TRUE, remove_separators = TRUE) %>% tokens_tolower() %>% tokens_remove(c(stopwords("german", "nltk"), "rt", "#*", "@*")) %>% tokens_select(min_nchar = 2) %>% tokens_keep("\\w+", valuetype = "regex") ``` We will also need a DFM: ```r btw_dfm <- dfm(btw_tokens) ``` --- # Exercise solutions The rest is just applying the various text and word metrics function. For example, get a list of most frequent words per account: ```r textstat_frequency(btw_dfm, n = 3, groups = author) ``` ``` ## feature frequency rank docfreq group ## 1 the 26 1 21 ABaerbock ## 2 heute 23 2 23 ABaerbock ## 3 mehr 22 3 21 ABaerbock ## 4 heute 32 1 30 ArminLaschet ## 5 the 23 2 8 ArminLaschet ## 6 ministerpräsident 22 3 22 ArminLaschet ## 7 heute 85 1 81 OlafScholz ## 8 mehr 76 2 67 OlafScholz ## 9 müssen 66 3 63 OlafScholz ``` --- # Exercise solutions Or all collocations in the tweets: ```r textstat_collocations(btw_tokens) ``` ``` ## collocation count count_nested length lambda z ## 1 ab uhr 17 0 2 6.394060 16.01189 ## 2 bürger innen 16 0 2 5.769122 14.72774 ## 3 sagt bundesfinanzminister 13 0 2 5.455357 14.10808 ## 4 herzlichen glückwunsch 15 0 2 8.716410 13.77752 ## 5 geht's los 12 0 2 7.930611 13.42734 ## 6 unserer gesellschaft 10 0 2 5.676450 13.21986 ## 7 bürgerinnen bürger 12 0 2 7.832576 12.93256 ## 8 gleich geht's 8 0 2 6.689422 12.36857 ## 9 live dabei 8 0 2 5.419750 11.97853 ## 10 dafür sorgen 11 0 2 6.067464 11.93917 ## 11 vielen dank 7 0 2 6.261835 11.88686 ## 12 europäische union 7 0 2 6.153480 11.80651 ## 13 gutes gespräch 6 0 2 6.469644 11.37955 ## 14 seit jahren 7 0 2 5.498415 11.16812 ## 15 of the 9 0 2 4.135198 10.64397 ## 16 gesellschaft respekts 6 0 2 6.237010 10.63205 ## [ reached 'max' / getOption("max.print") -- omitted 665 rows ] ``` --- # Exercise solutions For keyness, you first need to group the DFM per author and then set the target account: ```r btw_dfm %>% dfm_group(author) %>% textstat_keyness(target = "ABaerbock") ``` ``` ## feature chi2 p n_target n_reference ## 1 from 25.808169 3.770891e-07 9 0 ## 2 is 23.007328 1.613850e-06 15 8 ## 3 born 22.494735 2.107204e-06 8 0 ## 4 klimaschutz 20.384591 6.333776e-06 14 8 ## 5 jewish 19.187319 1.184980e-05 7 0 ## 6 kinder 18.305508 1.881623e-05 16 12 ## 7 to 17.086892 3.570791e-05 18 16 ## 8 of 16.084673 6.057230e-05 21 22 ## 9 girl 15.888712 6.717818e-05 6 0 ## 10 herzlichen 15.709383 7.385688e-05 13 8 ## 11 this 15.176496 9.791462e-05 8 2 ## 12 and 13.632950 2.222504e-04 18 19 ## 13 been 12.603943 3.849338e-04 5 0 ## 14 deported 12.603943 3.849338e-04 5 0 ## 15 more 12.603943 3.849338e-04 5 0 ## 16 winfried 12.603943 3.849338e-04 5 0 ## 17 jahre 12.248282 4.656868e-04 15 15 ## 18 kind 12.235172 4.689701e-04 7 2 ## 19 are 10.497441 1.195400e-03 8 4 ## 20 verloren 9.392023 2.179316e-03 6 2 ## [ reached 'max' / getOption("max.print") -- omitted 6143 rows ] ``` --- # Exercise solutions ```r btw_dfm %>% dfm_group(author) %>% textstat_keyness(target = "OlafScholz") ``` ``` ## feature chi2 p n_target n_reference ## 1 bundesfinanzminister 30.994409 2.587728e-08 45 0 ## 2 uhr 22.347416 2.275190e-06 43 3 ## 3 innen 21.986248 2.746111e-06 60 9 ## 4 geht 20.749690 5.234004e-06 58 9 ## 5 gesellschaft 20.142413 7.188483e-06 33 1 ## 6 dafür 19.743496 8.856255e-06 59 10 ## 7 respekt 18.771061 1.473867e-05 31 1 ## 8 schaltet 15.130191 1.003456e-04 22 0 ## 9 spd 15.015281 1.066442e-04 32 3 ## 10 gibt 13.852374 1.977467e-04 36 5 ## 11 schaffen 13.301928 2.651333e-04 23 1 ## 12 live 13.100998 2.951384e-04 32 4 ## 13 kanzlerkandidat 13.064438 3.009554e-04 19 0 ## 14 plan 12.376033 4.348801e-04 18 0 ## 15 sagt 11.234277 8.030039e-04 49 12 ## 16 ganz 11.201510 8.173081e-04 29 4 ## 17 ostdeutschland 10.311353 1.322143e-03 15 0 ## 18 darum 9.820005 1.726239e-03 24 3 ## 19 bürger 9.336305 2.246581e-03 26 4 ## 20 geht's 9.229010 2.382104e-03 17 1 ## [ reached 'max' / getOption("max.print") -- omitted 6143 rows ] ``` --- # Exercise solutions ```r btw_dfm %>% dfm_group(author) %>% textstat_keyness(target = "ArminLaschet") ``` ``` ## feature chi2 p n_target n_reference ## 1 ministerpräsident 91.332497 0.000000e+00 22 1 ## 2 nordrhein-westfalen 69.321275 1.110223e-16 16 0 ## 3 de 36.070796 1.902772e-09 12 3 ## 4 gespräch 27.794642 1.348992e-07 13 7 ## 5 modernisierungsjahrzehnt 27.315149 1.728519e-07 7 0 ## 6 la 22.329953 2.295973e-06 7 1 ## 7 düsseldorf 18.054805 2.146362e-05 5 0 ## 8 nrw-ministerpräsident 18.054805 2.146362e-05 5 0 ## 9 et 13.617375 2.241018e-04 5 1 ## 10 tweet 13.462455 2.433851e-04 4 0 ## 11 wolfgang 13.462455 2.433851e-04 4 0 ## 12 minister 13.045333 3.040411e-04 7 4 ## 13 with 10.847924 9.890656e-04 8 7 ## 14 armin 10.508752 1.188105e-03 5 2 ## 15 freund 9.455777 2.104851e-03 4 1 ## 16 präsidenten 9.455777 2.104851e-03 4 1 ## 17 austausch 9.446190 2.115881e-03 8 8 ## 18 gutes 9.446190 2.115881e-03 8 8 ## 19 on 9.446190 2.115881e-03 8 8 ## 20 außenminister 8.928127 2.808121e-03 3 0 ## [ reached 'max' / getOption("max.print") -- omitted 6143 rows ] ``` --- # Exercise solutions **Exercise 2: Applying dictionaries** Create the dictionary by creating a list of the two constructs and pass it to the `dictionary()` function: ```r liu_dict <- dictionary(list( positive = positive_words, negative = negative_words )) ``` --- # Exercise solutions Weighting the DFM before applying the dictionary gives the proportion of *construct terms* in the document: ```r guardian_dfm %>% dfm_weight(scheme = "prop") %>% dfm_lookup(liu_dict) ``` ``` ## Document-feature matrix of: 10,000 documents, 2 features (0.92% sparse) and 5 docvars. ## features ## docs positive negative ## 1 0.02152080 0.03873745 ## 2 0.03658537 0.02439024 ## 3 0.02188184 0.01969365 ## 4 0.02828283 0.03232323 ## 5 0.01991150 0.01880531 ## 6 0.03152174 0.01630435 ## [ reached max_ndoc ... 9,994 more documents ] ``` --- # Exercise solutions Weighting the DFM after applying the dictionary gives the proportion of *constructs* in the document (ignoring all other terms): ```r guardian_dfm %>% dfm_lookup(liu_dict) %>% dfm_weight(scheme = "prop") ``` ``` ## Document-feature matrix of: 10,000 documents, 2 features (0.92% sparse) and 5 docvars. ## features ## docs positive negative ## 1 0.3571429 0.6428571 ## 2 0.6000000 0.4000000 ## 3 0.5263158 0.4736842 ## 4 0.4666667 0.5333333 ## 5 0.5142857 0.4857143 ## 6 0.6590909 0.3409091 ## [ reached max_ndoc ... 9,994 more documents ] ``` --- # Exercise solutions If we use the second way (proportion of constructs), we only need to plot one category; 50% then marks the transition from predominantly positive to predominantly negative sentiment: ```r p_guardian_sentiment_liu <- guardian_dfm %>% dfm_group(day) %>% dfm_lookup(liu_dict) %>% dfm_weight(scheme = "prop") %>% tidy() %>% filter(term == "positive") %>% mutate(day = as.Date(document)) %>% ggplot(aes(x = day, y = count)) + geom_line(color = "blue") + geom_hline(yintercept = .5, linetype = "dashed") + theme_classic() + scale_y_continuous(labels = scales::percent) + labs(x = NULL, y = "Share of positive sentiment") ``` --- # Exercise solutions ```r p_guardian_sentiment_liu ``` 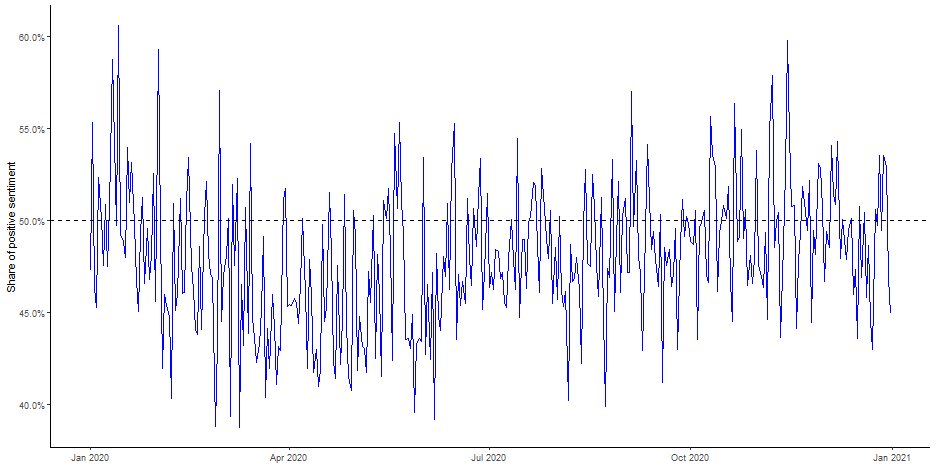<!-- --> --- class: middle # Thanks Credits: - Slides created with [`xaringan`](https://github.com/yihui/xaringan) - Title image by [Joshua Hoehne / Unsplash](https://unsplash.com/photos/j2Qa8culzDY) - Coding cat gif by [Memecandy/Giphy](https://giphy.com/gifs/memecandy-LmNwrBhejkK9EFP504)